
What to wear in 60 degree weather comes down to trousers or jeans, a thin sweater or shirt with sleeves, and an outer piece light enough to carry, because a 60-degree high comes, on average, with a far cooler start. Of 20 US cities checked against NOAA’s 1991 to 2020 climate normals, 16 have a month with a normal high within 5°F of 60°F (15.6°C), and in each city’s closest month the normal low runs from 12.5°F below the high in San Francisco to 27.8°F below it in Denver. Wind is the next thing to check: at 60°F in the shade, a 20 mph wind lowers apparent temperature by about 11°F, computed from the Australian Bureau of Meteorology’s formula.
60 degree weather outfits
Clothes for 60 degree weather work best as separate pieces, so the outer one can come off by midday. The table below is this guide’s own compilation, not a rule from any one source, and effort and how warm you run matter as well, as REI says of any advice based on weather alone. It leans on the three jobs REI assigns to layers (next to the skin, moving sweat away; in the middle, holding heat; on the outside, stopping wind and rain) and, for the work row, on the business casual lists in the Emily Post Institute’s attire guide.
| Occasion | Women | Men | Shoes |
|---|---|---|---|
| Work | A long skirt or wide trousers, a silk top, an unstructured layer to shed at the desk | Wool trousers or khakis, a collared shirt, a merino crewneck to shed at the desk | Loafers or low boots |
| Weekend | Straight-leg jeans, a T-shirt, an overshirt or denim jacket | Jeans or chinos, a T-shirt, an overshirt or zip sweatshirt | Sneakers |
| A full day on your feet | Stretch trousers, a merino tee, a zip fleece, a rain shell in the bag | Travel trousers, a merino tee, a zip fleece, a rain shell in the bag | Walking shoes already broken in |
| Evening out | A knit dress, or dark trousers with a silk top, plus a wrap or leather jacket for the walk home | Dark trousers or dark jeans, a merino knit, a cotton bomber or soft jacket | Ankle boots, low heels or loafers |
| Rain | Any outfit here under a rain jacket; swap cotton closest to the body for wool or synthetics | Rubber-soled shoes or boots that can get wet | |
A dress or skirt works as well as trousers once the coldest part of the morning has passed; before that, boots or tights cover what the hem leaves out. Sandals follow the same logic: fine for the afternoon, cold at breakfast. A scarf or thin hat adds warmth in the morning and fits in a bag by noon. Read the forecast low before choosing the outer layer. When the low is 20°F or more under the high, as it normally is in Denver, Nashville, Dallas, Salt Lake City and Houston in the months listed below, the morning calls for a real jacket, and that jacket spends the afternoon over your arm. When the gap is closer to 10°F, a thin sweater may be all the extra you need.
Holiday plans can fall on a day like this too. In Dallas, Las Vegas, San Francisco and Atlanta the December normal high runs from 56.2°F to 57.9°F, so a daytime party there may not need a winter coat, though the walk home might, with normal lows from 38.3°F to 47.0°F; the guide to what to wear to a Christmas party covers the dress codes. What to wear to Thanksgiving dinner lists normal highs for that holiday, with Atlanta and Dallas at 61°F and 63°F. Indoors, take the layer with you anyway: in the guide to what to wear to the ballet, four of 29 companies warn that the auditorium can be cold or is air conditioned.
How far the morning sits below the high: 20 US cities
This table uses NOAA’s 1991 to 2020 U.S. Climate Normals, published by its National Centers for Environmental Information (NCEI). A normal is a 30-year average, not a forecast. For each of 20 cities, a script read the monthly normal high and low for all 12 months from NCEI’s station file, picked the month whose normal high is closest to 60°F, and computed the swing as high minus low. The cities were chosen to span climates, and they are a sample, not the whole country. “Near 60” here means within 5°F, a cutoff this guide chose.
| City (NCEI weather station) | Month with the normal high closest to 60°F | Normal high | Normal low | Swing |
|---|---|---|---|---|
| A month within 5°F of 60°F, widest swing first | ||||
| Denver (Denver International Airport) | April | 61.7°F (16.5°C) | 33.9°F (1.1°C) | 27.8°F |
| Nashville (airport) | November | 61.4°F (16.3°C) | 39.2°F (4.0°C) | 22.2°F |
| Dallas (DFW Airport) | February | 60.9°F (16.1°C) | 40.1°F (4.5°C) | 20.8°F |
| Salt Lake City (airport) | April | 61.9°F (16.6°C) | 41.8°F (5.4°C) | 20.1°F |
| Houston (Bush Intercontinental Airport) | January | 63.8°F (17.7°C) | 43.7°F (6.5°C) | 20.1°F |
| Atlanta (Hartsfield-Jackson Airport) | February | 58.2°F (14.6°C) | 38.9°F (3.8°C) | 19.3°F |
| Chicago (O’Hare Airport) | April | 59.0°F (15.0°C) | 40.3°F (4.6°C) | 18.7°F |
| Portland, Oregon (airport) | April | 62.0°F (16.7°C) | 43.7°F (6.5°C) | 18.3°F |
| Las Vegas (airport) | January | 58.5°F (14.7°C) | 40.5°F (4.7°C) | 18.0°F |
| Minneapolis-St. Paul (airport) | October | 58.1°F (14.5°C) | 40.9°F (4.9°C) | 17.2°F |
| Philadelphia (airport) | November | 55.9°F (13.3°C) | 38.8°F (3.8°C) | 17.1°F |
| Washington, DC (Reagan National Airport) | November | 58.2°F (14.6°C) | 41.6°F (5.3°C) | 16.6°F |
| New York (Central Park) | April | 61.8°F (16.6°C) | 45.5°F (7.5°C) | 16.3°F |
| Boston (Logan Airport) | October | 62.1°F (16.7°C) | 47.5°F (8.6°C) | 14.6°F |
| Seattle (Sea-Tac Airport) | October | 60.5°F (15.8°C) | 47.0°F (8.3°C) | 13.5°F |
| San Francisco (downtown) | February | 60.4°F (15.8°C) | 47.9°F (8.8°C) | 12.5°F |
| No month within 5°F of 60°F, widest swing first | ||||
| Phoenix (Sky Harbor Airport) | December | 66.2°F (19.0°C) | 45.3°F (7.4°C) | 20.9°F |
| Los Angeles (downtown, USC campus) | December | 67.4°F (19.7°C) | 48.2°F (9.0°C) | 19.2°F |
| San Diego (Lindbergh Field) | December | 66.0°F (18.9°C) | 49.8°F (9.9°C) | 16.2°F |
| Miami (airport) | January | 76.2°F (24.6°C) | 61.0°F (16.1°C) | 15.2°F |
Highs and lows are NCEI’s values, to one decimal place; Celsius figures were converted for this guide from those same values, and the swing was computed here. NCEI’s own daily range column agrees with it to within 0.1°F in every month at every station. NCEI rates each value in the table as meeting its standard test for data availability, except San Diego’s December high, which it rates as representative, with 23 years of data. Most stations are at airports, and the station matters: at San Francisco International Airport the February swing is 14.7°F, against 12.5°F downtown. Station IDs are in the sources.
- A large gap is the normal case. In the closest month at each of the 16 cities near 60°F, the gap is at least 12.5°F, 15°F or more in 13 of them, and 20°F or more in five. The median is about 18°F. Other months within 5°F can fall outside that range: San Francisco’s December swing is 10.9°F and Denver’s March swing is 28.2°F.
- The morning can be near freezing. Denver’s April normal low is 33.9°F (1.1°C). Philadelphia, Atlanta and Nashville also have normal lows under 40°F in their months nearest 60°F, and no city among the 16 has one above 47.9°F.
- The month depends on the place. The closest month is April in five of the 16 (New York, Chicago, Denver, Salt Lake City, Portland), October in three (Boston, Minneapolis-St. Paul, Seattle) and November in three (Nashville, Washington, Philadelphia). In San Francisco, Dallas, Atlanta, Las Vegas and Houston it is January or February, so 60°F there is mostly a winter high, though San Francisco stays within 5°F of it in seven months, from November to May.
- Four cities have no month near it. San Diego’s coolest month has a normal high of 66.0°F, Phoenix’s 66.2°F, Los Angeles’s 67.4°F and Miami’s 76.2°F, which puts a 60-degree day in any of them below normal, even in that month. Miami’s January normal low, 61.0°F, is warmer than 60.
The table cannot say why one city swings more than another. A training page from the National Weather Service gives the general pattern: cloud keeps a night from cooling as far, while a clear sky, dry air and little wind are what the coldest nights usually share. So on any given day, a clear forecast argues for more at breakfast than a cloudy one does.
A normal is also only a middle value. In NCEI’s hourly normals for April in Chicago, the reading at 3 in the afternoon, standard time, has a 10th percentile of 41.2°F and a 90th percentile of 72.3°F, averaged over the month’s days. Seattle’s October runs from 51.4°F to 65.7°F on the same measure. Look up the actual forecast before getting ready.
How to dress for 60 degree weather from morning to evening
NCEI also publishes hourly normals, in local standard time, and 17 of the 20 stations have them (Central Park, downtown San Francisco and the USC campus in Los Angeles do not). Averaged across the days of the closest month at each station, the coolest hour falls between 5 and 7 a.m. standard time at all 17, and the warmest between 1 and 4 p.m. Clock time is an hour later during daylight time. Early morning is when most daily lows arrive, going by the national high and low page of NOAA’s Weather Prediction Center.
Four cities in April or October, when clocks are on daylight time:
| City and month | 8 a.m. | 1 p.m. | 4 p.m. | 7 p.m. | 10 p.m. |
|---|---|---|---|---|---|
| Denver, April | 41.8°F | 56.4°F | 58.5°F | 53.6°F | 45.1°F |
| Chicago, April | 45.3°F | 54.7°F | 55.8°F | 52.3°F | 47.8°F |
| Boston, October | 51.4°F | 59.5°F | 59.9°F | 56.6°F | 54.3°F |
| Seattle, October | 48.9°F | 56.3°F | 58.2°F | 54.3°F | 52.2°F |
These hourly averages top out a few degrees under the normal high (55.9°F against 59.0°F in Chicago), partly because the warmest moment does not fall at the same hour every day. The shape is the useful part. Denver gains 14.6°F between 8 a.m. and 1 p.m. and is back to 45.1°F by 10 p.m., so a jacket that felt silly at lunch earns its place again after dinner. Boston stays above 50°F all day in October, and a thin sweater may cover it. Seattle’s day moves less than Denver’s: 48.9°F to 58.2°F across the table’s hours.
REI’s answer to changing conditions is simple: have the unworn layer with you. For a city day, that means a jacket light enough to carry, or one that packs into a bag.
What 60°F feels like in wind, humidity and sun
The National Weather Service’s two “feels like” measures say little at this temperature. Wind chill is defined only at 50°F or colder, with wind above 3 mph. Heat index is built for warm air: its equation page keeps the main regression for values of about 80°F and up and gives a simpler formula for everything under that, and the risk table on another NWS page begins at 80°F. That simpler formula does return a number at 60°F, but it barely moves with humidity, as the list below shows.
For a number at 60°F, this guide turned to the apparent temperature (AT) formula of Australia’s Bureau of Meteorology (BoM): AT = Ta + 0.33 × e − 0.70 × ws − 4.00. Ta is the air in °C and ws the wind in m/s, taken 10 meters up. The term e is vapor pressure in hPa: rh / 100 × 6.105 × exp(17.27 × Ta / (237.7 + Ta)), with rh the relative humidity. The model imagines an adult on foot in the shade and, when BoM uses it for wind chill, already dressed for the conditions, so a figure below is not an instruction to dress for that temperature. BoM offers the result as guidance only. Coded as written, it reproduced all nine cells this guide checked from BoM’s own published tables. The figures below were computed from it by this guide’s editors; they are not BoM’s numbers.
| Wind at 60°F, in the shade | 30% humidity | 60% humidity | 90% humidity |
|---|---|---|---|
| Calm | 56°F (13°C) | 59°F (15°C) | 62°F (17°C) |
| 10 mph | 50°F (10°C) | 53°F (12°C) | 57°F (14°C) |
| 20 mph | 45°F (7°C) | 48°F (9°C) | 51°F (11°C) |
- Wind moves the table most. Each 10 mph takes about 5.6°F off the result. In NCEI’s hourly normals, mean wind at 3 in the afternoon, standard time, runs from 5.5 mph (Phoenix) to 14.0 mph (Chicago) across the 17 stations in these months, mostly measured at airports, so the 10 mph row is an ordinary afternoon, not a windy one. For clothes, that argues for a top layer that stops wind: REI warns that fleece lets it through, which is why the full-day row above keeps a shell in the bag.
- Humidity matters less, and the formulas disagree on how much. Going from 30 to 90 percent adds about 6.3°F here, though BoM’s own text calls air humidity relatively unimportant in colder conditions, without saying where those begin. The National Weather Service’s simpler formula, averaged with the air temperature as its equation page directs, gives only 58.6°F to 60.0°F across that range.
- Sun is left out of the table. BoM says full sun adds at most about 8°C (about 14°F) to apparent temperature under Australian conditions, with the sun at its highest. That is an upper limit from another country, not a figure for every 60-degree afternoon. For the temperatures they cover, NWS pages give figures of the same size: wind chill can rise 10°F to 18°F in bright sun, and heat index up to 15°F in direct sun. So stepping into full sun can undo a layer. The CDC’s sun page makes a related point: UV does not stop for cloud or cool air, so sunscreen still belongs in the routine.
- Getting wet changes the sum. BoM warns that wet clothing cools a person more than its model predicts, and it names mild temperatures as a hypothermia risk for anyone underdressed in wet, windy weather. Even in air above 40°F a wet, chilled person can become hypothermic, says the CDC’s hypothermia page, though severe cold is the likelier setting. That is REI’s case for carrying a shell: it warns of a serious chill once wet and wind reach the clothes beneath.
Spring and fall at 60 degrees
Thirteen of the 20 cities have a month within 5°F of 60°F in each half of the year. Taking the closest month in each half, the first-half month has the wider swing in all 13, by 0.3°F to 3.3°F and 1.6°F on average. Four of those pairs (San Francisco, Las Vegas, Dallas, Atlanta) are winter months rather than spring and fall, and the highs in each pair are not equal, so the fairest comparisons are the true spring and fall pairs whose highs sit within 2°F of each other:
- Seattle: April 59.3°F high and 43.3°F low; October 60.5°F and 47.0°F. The spring morning is 3.7°F colder.
- Minneapolis-St. Paul: April 56.6°F and 37.5°F; October 58.1°F and 40.9°F. The spring morning is 3.4°F colder.
- Washington: March 56.5°F and 38.6°F; November 58.2°F and 41.6°F. The spring morning is 3.0°F colder.
- Nashville: March 62.7°F and 40.2°F; November 61.4°F and 39.2°F. Here the spring morning is 1.0°F warmer.
So spring mornings run a little colder in most of these pairs, by a few degrees, while the gap between one city and another is far larger. Normals cannot say whether 60°F feels different after a winter than after a summer, and no source read for this guide measures that.
Frequently asked questions
Is 60 degrees cold?
It is mild, and the answer depends on the wind, the sun and where you live. The BoM formula gives about 59°F in calm shade at 60 percent humidity and about 53°F with a 10 mph wind. BoM also says adaptation plays a part: what counts as comfortable runs higher for residents of hot climates. On that reasoning, which is this guide’s own, a Miami resident, whose normal January low is 61.0°F, may read 60°F as colder than someone from Minneapolis-St. Paul would.
Do you need a jacket in 60 degree weather?
Usually for the morning and evening, often not for the afternoon. In Denver’s April the hourly normal is 41.8°F at 8 a.m. and 45.1°F at 10 p.m., against 56.4°F at 1 p.m. In Boston’s October it stays between 51.4°F and 59.9°F across those hours, where a thin sweater may do. Choose something light enough to carry.
Can you wear shorts in 60 degree weather?
If they feel right, wear them; none of the sources read for this guide sets a cutoff for everyday wear. They suit a sunny, calm afternoon or a workout better than an early start, since the normal low in the closest month at the 16 cities near 60°F is between 33.9°F and 47.9°F. Running guides differ: between 45°F and 60°F New York Road Runners pairs shorts with a long-sleeved top, while Nike’s guide offers light pants or leggings there and saves shorts for 60°F and up.
What should you wear running in 60 degree weather?
Anyone asking what to wear running in 60 degree weather should dress lighter than for standing still. New York Road Runners puts 60°F at the line between two of its bands: from 45°F to 60°F it pairs tights with a short-sleeved technical top, or shorts with a long-sleeved one, and above 60°F it moves to shorts and a tank top. Nike’s guide repeats the common advice to add 10°F to 20°F to the reading, and a Cleveland Clinic article on cold-weather running quotes a sports medicine doctor’s figure of 15°F to 20°F. For a dawn run, go by the temperature at that hour, not the forecast high: New York Road Runners treats 32°F to 45°F as its cold band.
How should you dress a baby in 60 degree weather?
Give the baby more than you have on yourself. The American Academy of Pediatrics draws its line at 75°F. Under that, its baby-dressing guide wants a baby in several layers of clothing. Its rule of thumb is one layer beyond what keeps you comfortable. In a car seat, skip the puffy coat: the academy’s winter page wants thin clothing that fits close to the body. Babies born premature are a case the guide singles out: until they reach full-term weight, it says, they may need one more layer still. Neither page addresses 60°F by name.
Is 60 degrees the same in spring and fall?
On the thermometer, nearly; whether it feels the same after a winter as after a summer is something normals cannot say. In the pairs compared above, the spring month’s normal low is up to 3.7°F colder than the fall month’s in three of four cities, and 1.0°F warmer in Nashville. That is a small difference next to the gap between Denver and San Francisco.
What should you wear when it rains at 60 degrees?
A waterproof jacket over your normal layers, with shoes that can get wet. REI’s example for a half-day hike in cool rain puts a vented shell and rain pants over a thin fleece, synthetic trousers and light long underwear; on a city day the same idea shrinks to a shell over a thin sweater. REI’s warning about wet cotton is aimed at winter, but keep it in mind on a wet morning in the 40s.
Sources
- NOAA National Centers for Environmental Information, U.S. Climate Normals, accessed November 9, 2026
- NOAA National Centers for Environmental Information, 1991 to 2020 monthly normals, station files USW00003017, USW00003927, USW00012839, USW00012960, USW00013739, USW00013743, USW00013874, USW00013897, USW00014739, USW00014922, USW00023169, USW00023183, USW00023188, USW00023234, USW00023272, USW00024127, USW00024229, USW00024233, USW00093134, USW00094728, USW00094846, accessed November 9, 2026
- NOAA National Centers for Environmental Information, 1991 to 2020 hourly normals, the same stations where available, accessed November 9, 2026
- NOAA National Centers for Environmental Information, documentation for the monthly and hourly normals, and station inventory, accessed November 9, 2026
- National Weather Service, Understanding Wind Chill, accessed November 9, 2026
- NOAA Weather Prediction Center, Heat Index Equation (last modified May 12, 2022), accessed November 9, 2026
- National Weather Service Amarillo, What is the heat index?, accessed November 9, 2026
- NOAA Weather Prediction Center, National High and Low Temperature, accessed November 9, 2026
- National Weather Service, Atmospheric Controllers of Local Nighttime Temperature (training page), accessed November 9, 2026
- Australian Bureau of Meteorology, Thermal Comfort observations (page last updated 2010), accessed November 9, 2026
- REI Expert Advice, Layering Basics (updated August 23, 2024), accessed November 9, 2026
- US Centers for Disease Control and Prevention, Preventing Hypothermia; Sun Safety Facts, accessed November 9, 2026
- New York Road Runners, Gear Up for the Weather, accessed November 9, 2026
- Nike, What To Wear on Your Run Based on the Temperature, March 11, 2025
- Cleveland Clinic, Everything You Need to Know About Running in Cold Weather, February 11, 2021
- American Academy of Pediatrics, HealthyChildren.org, Tips for Dressing Your Baby (last updated June 17, 2016); Cold Weather Safety for Children (last updated January 25, 2023), accessed November 9, 2026
- Emily Post Institute, Attire Guide: Dress Codes from Casual to White Tie, August 2, 2020
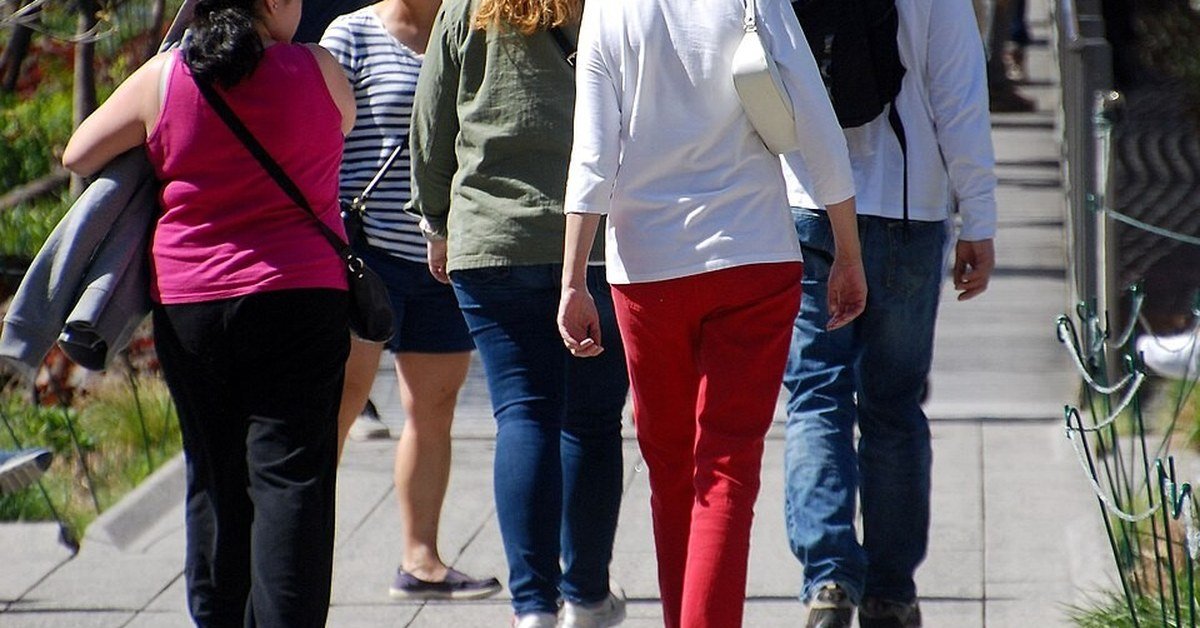
Lead photo: Walkers on the High Line in New York on April 18, 2016, one with a jacket over her arm. Photo: Ron Cogswell, CC BY 2.0, via Wikimedia Commons (cropped).